In
this note we explore the differences between business
sectors relative to their propensity to perform R&D activities.
We
use USA 2008 data (last data available through Science and Engineering
Indicators 2012, by NSF National Science Foundation) about R&D
performed and paid by companies of different sectors, a direct measure
of the commitment and importance of each sector to R&D activities.
In this note, R&D means R&D performed and paid by business.
Let’s
begin with industry groups defined by two digits NAICS classification,
the top level groups of economic activities. Industry performed 72% of
total R&D, and financed 84% of it - so other sources, basically
federal government, funded only 16% of R&D performed by USA
companies, mainly D activities). In USA statistics, industry R&D
has a meaning equivalent to business or corporate R&D in european
statistics and literature (but it does not include agriculture and farm
business).
Three
industry groups (2 digits NAICS classification) contribute with more
than 95% of R&D performed by industry: manufacturing is the most
important (71%, around half of total R&D), followed at distance by
information (16%) and professional, scientific and technical services
(9%).Overall, non manufacturing sectors (services, but also including
mining and primary metals) do contribute only with 29% of industry
R&D (equivalent to 21% of total R&D). (Mining and primary metals
together have only a 1% share of R&D).
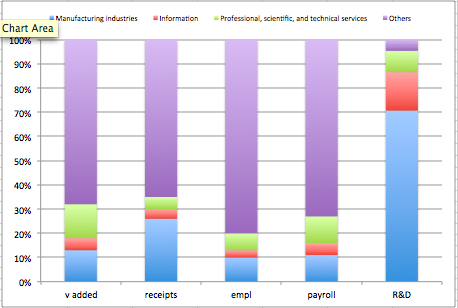
The
importance of these three groups of activities in corporate or business
R&D is very different from their importance in the volume of
economy. Next figure compares the overall structure of value added
(GDP), receipts (equivalent to “sales” or turnover), employment, payroll
and R&D by these sectors. Manufacturing (and information)
activities has a much larger importance in R&D than in the other
variables.
Next
figure shows R&D and receipts by top level NAICs industries.
Receipts are here used as equivalent to sales, and statistics about
receipts by companies are easily available from tax statistics. R&D
shown as negative values in this figure.
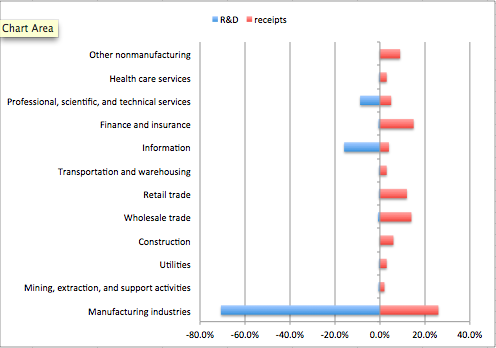
Overall
R&D intensity of USA industry, measured by the ratio R&D
performed and funded by companies versus receipts of companies, is
0.69%. Manufacturing sectors have an higher R&D intensity (1.9%)
than average, but information sector has an even higher intensity (3%).
Professional, scientific and technical services do have an 1.3%
intensity. These three sectors have the largest R&D intensity of all
industries. The remaining other sectors have an intensity of 0.05%.
Near all business R&D activities are concentrated in these three
2-digits NAICS economic sectors.
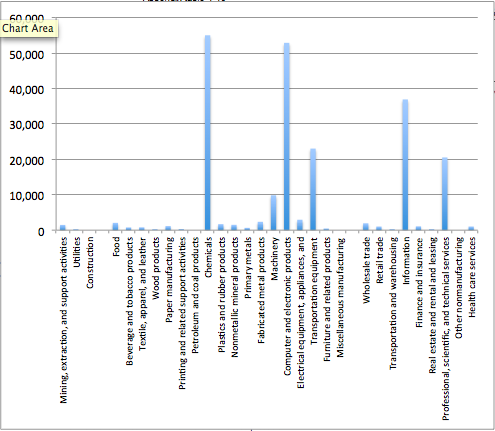
Next
let’s consider the next levels of NAICS. Next figure shows R&D
performed and paid by business, both for all the first level industries
previoulsy discussed as well as for the different manufacturing
subsectors (3 digits NAICS code, bars group in the middle).
Within
manufacturing, four subsectors show an higher level of R&D:
“chemicals” and “computers and related electronic products” are the top
ones, followed by “transportation equipment” and “machinery”. Together
these four subsectors contribute with 60% of the R&D spending in
manufacturing, and the first two together approached half of it (46%).
At 3 digits NAICS code, these are the manufacturing subsectors
concentrating most of the R&D effort. Together with “information”
and “professional, scientific and technical services”, they do have a
share of 84%.
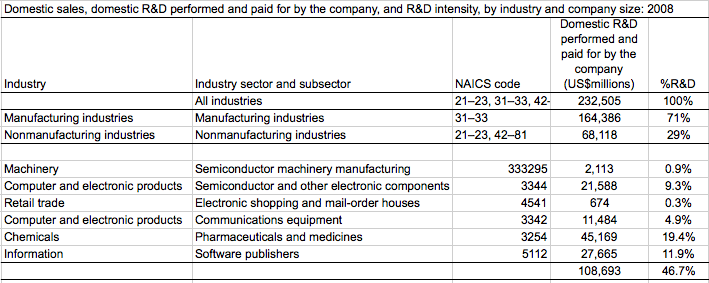
If
we go deeper in NAICS classification of economic activities, we will
find that a very few subsectors contribute to half of all R&D (see
table). Although small sectors, they have a very high R&D intensity,
although a minor role in the volume of the economy.
R&D
activities are very much concentrated in a small number of economic
activities, and the R&D propensity of different sectors has a strong
variation inter sectors. This means that the structure of the economic
tissue must strongly influence the business R&D contribution to GDP,
the classic indicator used to measure the level of commitment of
companies and business to R&D, and very often also used as a (bad)
indicator of innovation.
No comments:
Post a Comment